
Your velocity went up, and your forecasts got worse. That is the signature delivery paradox of 2026: teams adopt AI coding tools, sprint velocity climbs, and the number that used to anchor commitments quietly stops meaning anything. A feature estimated at eight story points might take twenty minutes to generate and four days to validate, or three days from the start. The estimate was not wrong; it just stopped being a reliable input into any commitment 1. This article is about why that happens and what consulting teams do about it: the assumption velocity was built on, the split AI introduced, and the flow-based forecasting practices that survive contact with AI-assisted delivery.
What velocity actually was
Story points were never hours; that is the whole point of them. Two developers with different skill levels cannot agree on how long a task will take, but they can agree it is a 3 and not an 8. Scrum.org's Piyush Rahate uses a road-trip analogy: one driver needs eight hours for a 500-kilometer trip, the other twelve, but both agree the distance is 500 kilometers. Points are the kilometers of knowledge work, an abstract measure a whole team can agree on even when individual speeds differ 2.
Velocity is the rate at which those relative units get done, and forecasting is the only job it was ever good at. But forecasting only worked because of a hidden assumption: that complexity maps to effort in a roughly stable way, the assumption our complicated-versus-complex delivery diagnostic names as the category error at the root of point-based estimation. If this sprint produced X points, the next one probably will too. Imperfect but directional. Enough to plan against.
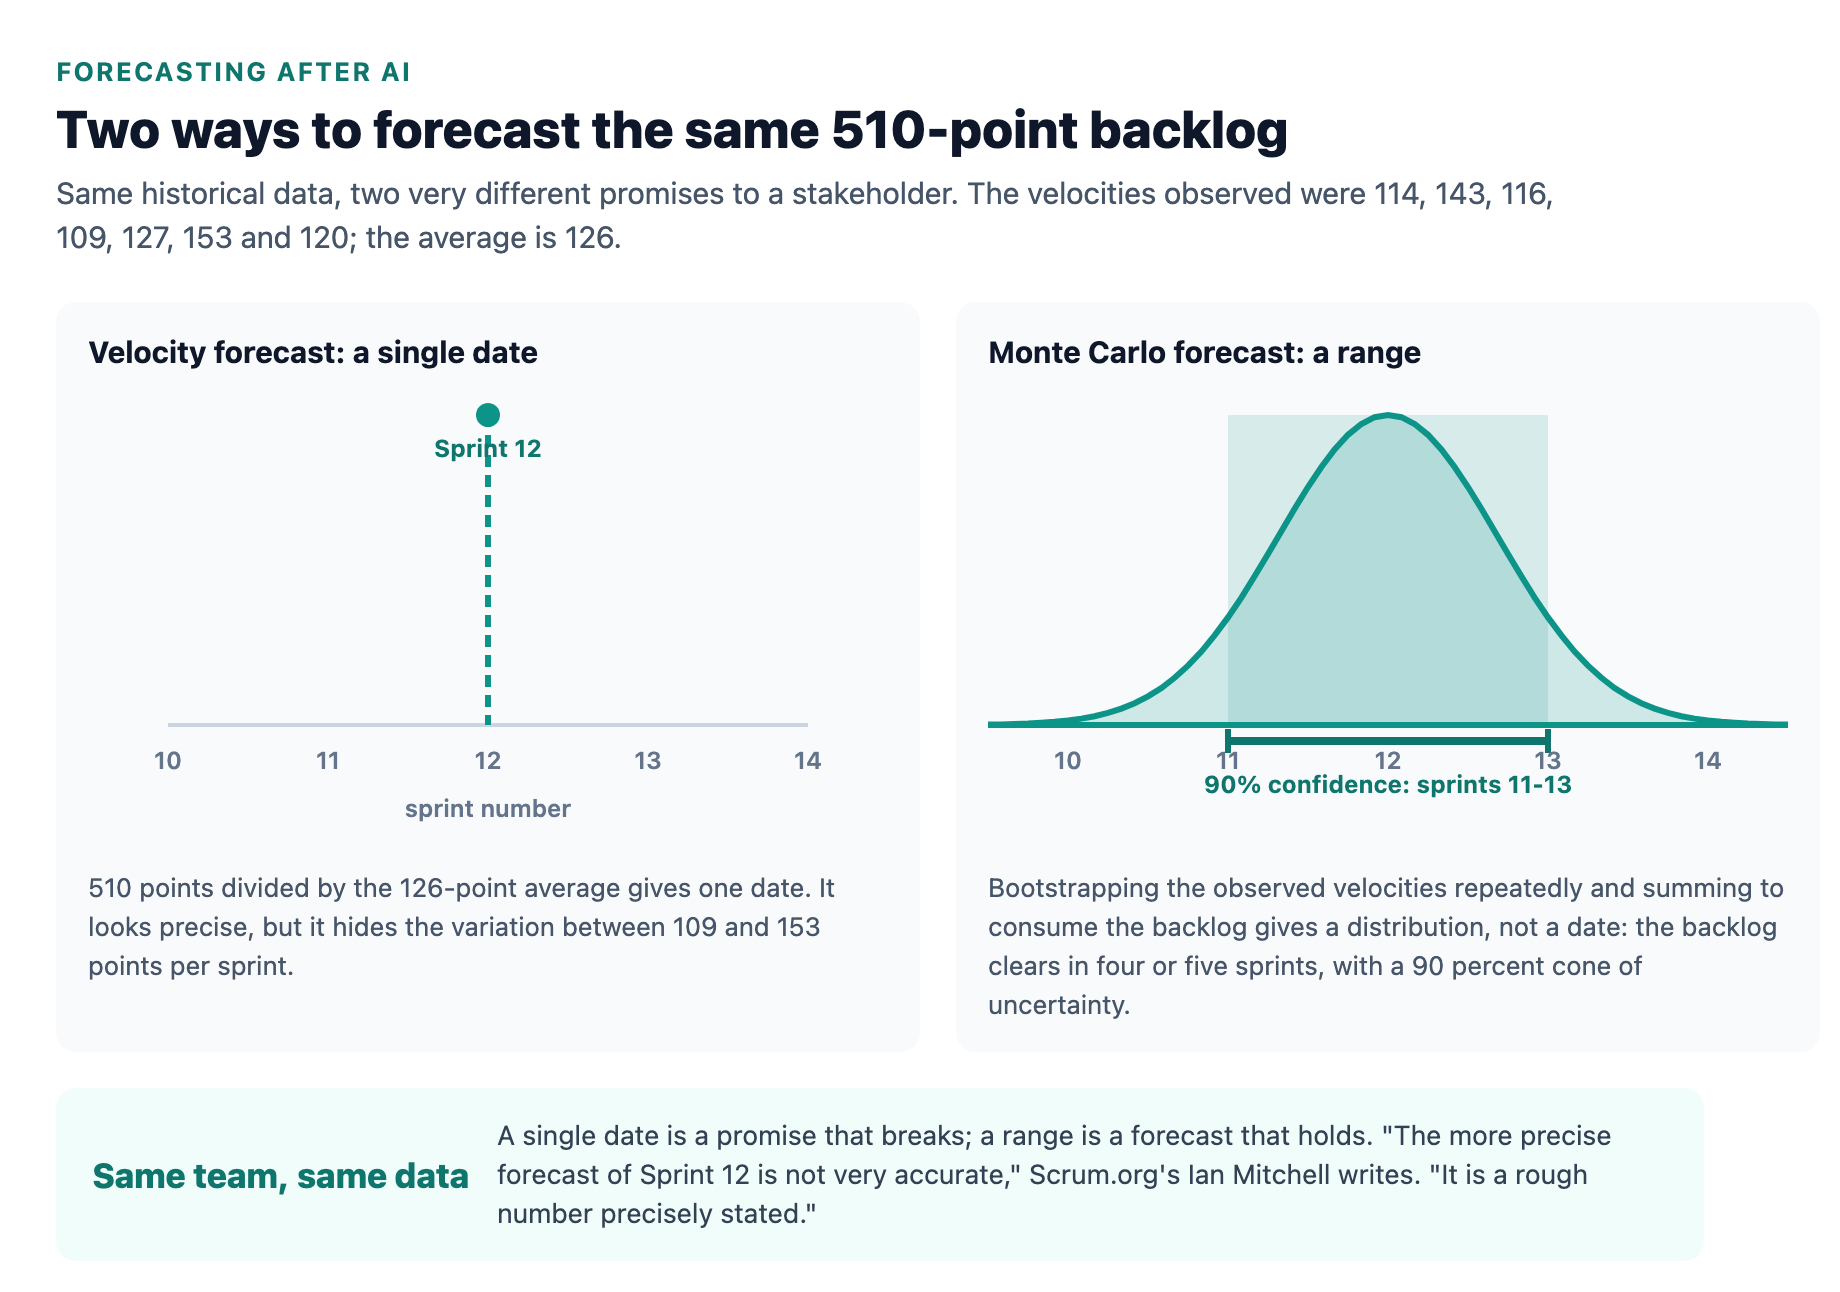
The forecast itself was always a range problem dressed up as a number. Scrum.org's Ian Mitchell runs the canonical example: a 510-point backlog with recent velocities of 114, 143, 116, 109, 127, 153 and 120 points. The average, 126 points per sprint, says the backlog clears in just over four sprints. But the velocities vary between 109 and 153, and that variation is real information. Bootstrapping the observed velocities, repeatedly drawing from them and summing until the backlog is consumed, produces a distribution: the backlog clears in four or five sprints at 90 percent confidence, not a single date 3. "The more precise forecast of Sprint 12 is not very accurate," Mitchell writes. "It is a rough number precisely stated." The precision was always fake; the variation was the truth.
What AI did: it split the estimate in half
AI did not make velocity numbers lower or higher; it broke the relationship the numbers were built on. The old model assumed a unimodal distribution: complexity maps to effort in one roughly stable hump around human-hours. AI splits that hump in two. Generation work, getting an AI assistant to produce code, is fast, cheap and scalable, often minutes. Validation work, reviewing that code for correctness, security and integration, is slow, expensive and cognitively bounded, often days, the same review bottleneck our guardrails for AI-generated code are built around 1.
Teams feel this as a strange kind of brokenness. An eight-point feature is debated for thirty minutes in planning poker, a developer prompts an assistant, working code appears in two minutes, and then comes three days of code review, security validation, integration testing and refactoring. The Fibonacci sequence does not have a number for "two minutes plus three days of cognitive-heavy review work" 1. The acceleration is not uniform either: front-end work flows through AI easily, while architectural integrations are faster on first pass but demand extensive manual review.
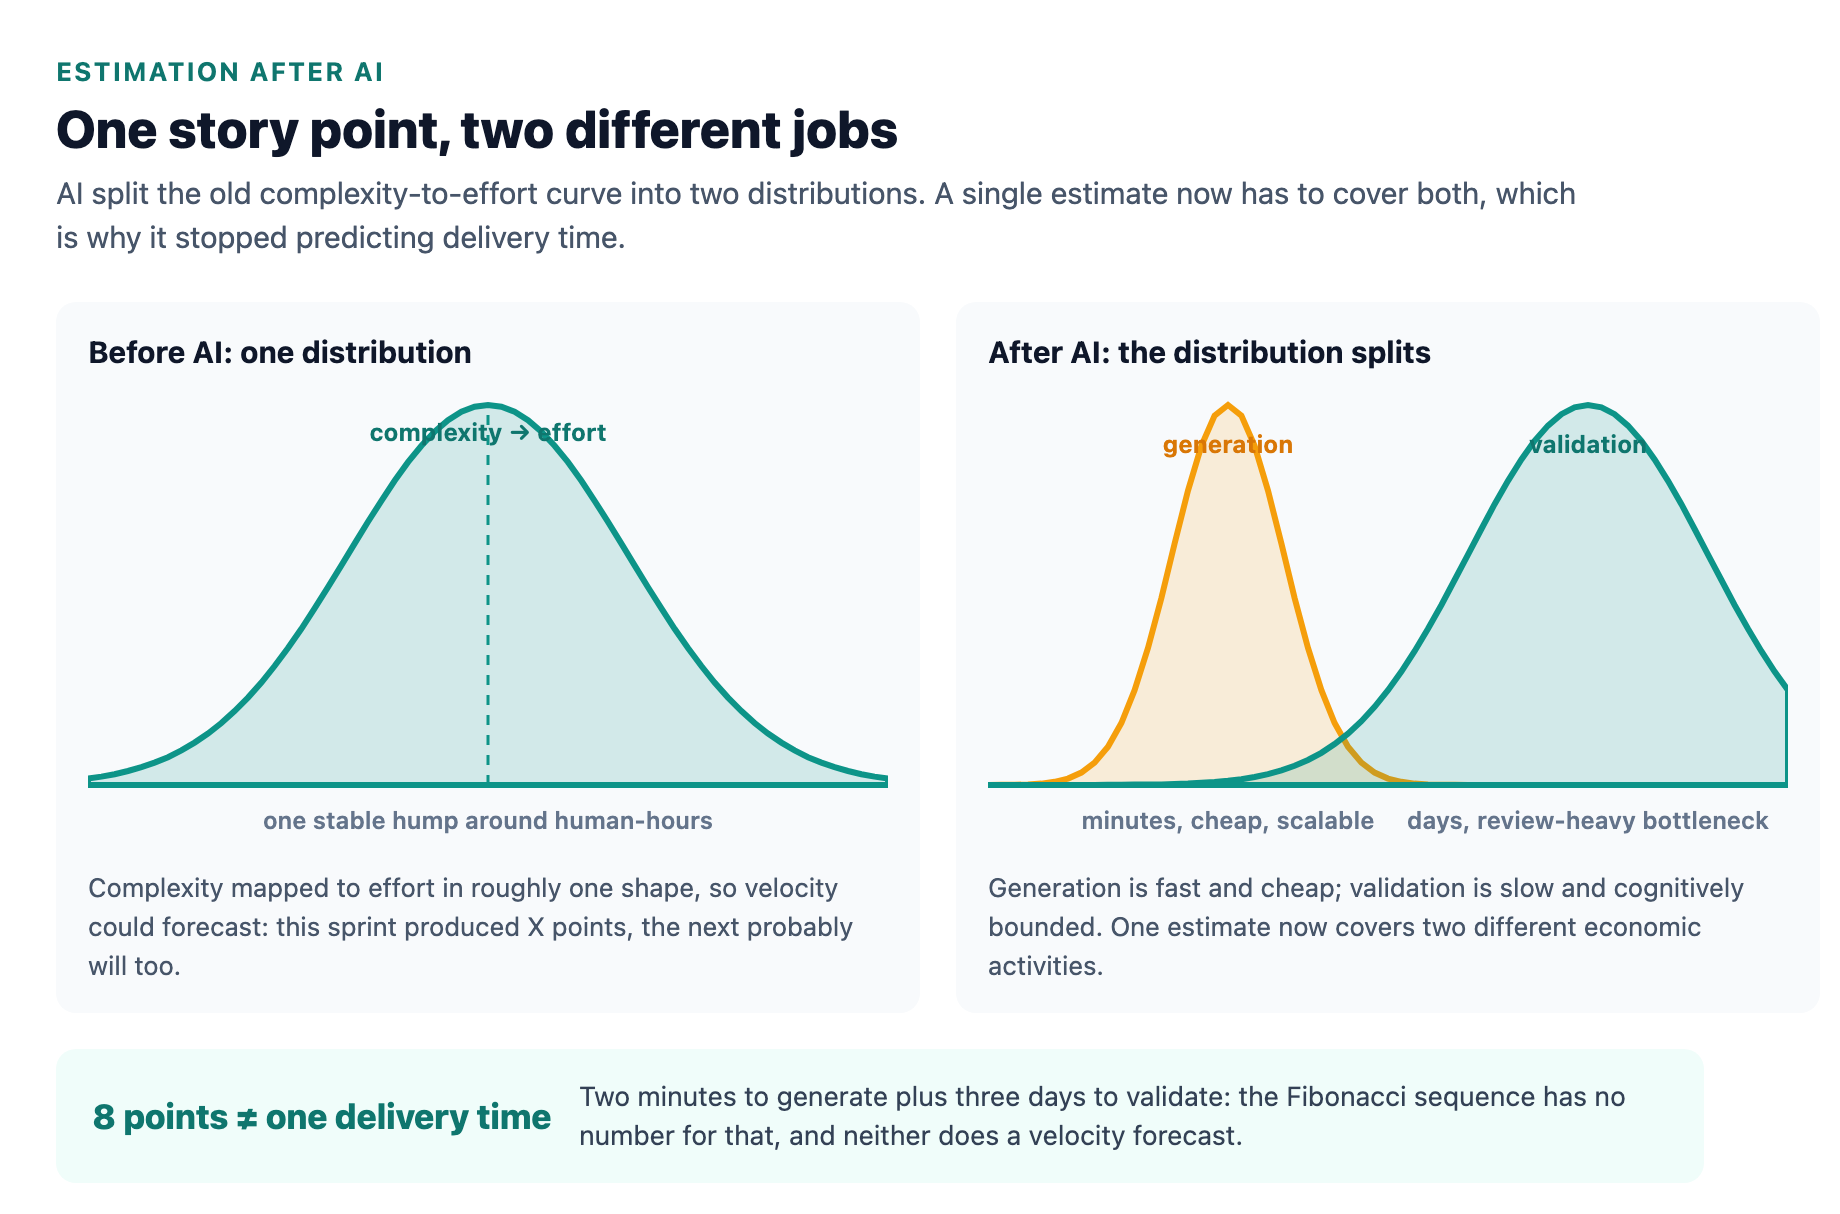
The mechanism matters more than the anecdote. Any estimation model that assumes a stable relationship between complexity and developer time faces the same break: story points make it visible, but it transfers to T-shirt sizing, hourly estimates and fixed-bid contracts equally. As StratoAtlas's analysis of the pattern puts it, AI did not break estimation; it broke the assumption that estimation can anchor commitments 1. The velocity number still comes out every sprint. It just is not anchored to anything anymore.
The behavioral trap is that teams respond by recalibrating: add more scope per sprint, adjust point values, refine the planning poker ritual. Those are interventions at the calibration layer, but the problem sits one layer down, at the assumption that complexity and effort still travel together. Recalibrating inside a broken model is a proxy fix; the tension does not resolve, it accumulates as commitments built on unreliable inputs 1.
The cracks that were already there
None of this is a new critique of story points; the cracks were visible long before AI. 55degrees' delivery-leadership analysis frames the original sin: "The problem usually isn't bad estimation. It's what estimation is being asked to do." Story points were designed for team-level conversations, to surface assumptions and build shared understanding. Trouble starts when estimates get stretched beyond that context, aggregated across teams and rolled up into system-level forecasts, because different teams estimate differently, context gets lost, and variability gets hidden inside averages 4.
The anti-patterns are well documented. Rahate lists the classics: teams equate a point with a fixed number of hours, with no evidence for the conversion; teams estimate without ever establishing a baseline for relative comparison; management treats velocity as a commitment and even writes it into contracts, one organization he worked with had a statement of work clause requiring the team to deliver 60 story points every sprint before the team even existed. Velocity commitments invite inflation: developers pad estimates to protect themselves, which quietly destroys the data the forecast depends on 2.
The deeper issue is that points are team-local. A 3 on one team is not a 3 on another, so rolling points up across teams is comparing distances measured with different odometers. This was already why system-level forecasting from points was fragile. AI did not create the fragility; it made it impossible to ignore.
The fix: forecast flow, not effort
The alternative that survives AI is not no-estimates; it is evidence-based forecasting built on flow metrics. Daniel Vacanti's Actionable Agile Metrics defines the four: Work in Progress, the number of items started but not finished; Cycle Time, how long an item takes from start to finish; Throughput, how many items finish per unit of time; and Work Item Age, how long a started item has been in the system 5.
The decisive property is that throughput counts items, not size. Scrum.org's Yuval Yeret flags it explicitly: throughput is the exact count of work items without any compensation for size, "a major difference between throughput and story-points based velocity" 5. That is exactly the property you want when the size-to-effort mapping has come unglued. When AI collapses the generation half of a task from days to minutes, the item count does not care; but cycle time will faithfully reflect the validation bottleneck, because the item cannot finish until the slow half is done.
Forecasting from flow data means running a Monte Carlo simulation over historical throughput or cycle time to get a probability distribution: not "sprint 12" but "between sprints 11 and 13 at 90 percent confidence." Scrum.org recommends exactly this in Sprint Review, pairing throughput with Monte Carlo simulations for release planning and roadmap conversations to give stakeholders visibility into what can be done by when, with the explicit caveat that these are projections and forecasts, not commitments 5.
The same metrics discipline the in-sprint conversation. Cycle time is a lagging indicator, only available once work finishes, so teams set a Service Level Expectation, an agreed statement of the cycle time an item type should see and at what confidence, say 16 days at 85 percent. Work item age then acts as a leading indicator for items already started: a card that has been in the system for ten days against a 16-day expectation is either nearly done or stuck, and the aging-WIP view shows which 5.
None of this abandons planning; it changes what informs it. 55degrees makes the point bluntly: what delivery leaders are missing is not better estimation, it is evidence, and flow-based thinking explains why starting more work often leads to finishing less 4. Planning still matters; it is just grounded in observed behavior instead of negotiated guesses.
The consulting migration path
The migration is a three-step sequence, and the first step is the one most teams skip.
Instrument first. You need empirical variance data by task type before you can route anything. StratoAtlas's constraint is honest about the cost: it takes two to four sprints of instrumented work to build that data, and most delivery organizations under client pressure do not have that runway. Plan for it explicitly, and tell the client why: the first two sprints are the calibration cost of switching from opinion-based to evidence-based forecasting 1.
Then separate the work. Before sprint planning, classify tasks into high-AI-variance and low-AI-variance buckets. High variance means the validation half dominates and is unpredictable: architectural work, security-critical paths, integration-heavy features. Low variance means the task is well-scoped and the generation half does most of the work. The classification does not need to be perfect; it needs to exist, because the two buckets get different treatment 1.
Then change what commitments attach to. For high-variance tasks, commit to validation capacity, not generation output: attach the timeline to the validation phase, budget review and integration capacity as the scarce resource, and in fixed-scope contracts price validation as a separate line item. A delivery organization that prices generation speed and hands off validation risk is not underestimating; it is pricing the wrong thing 1.
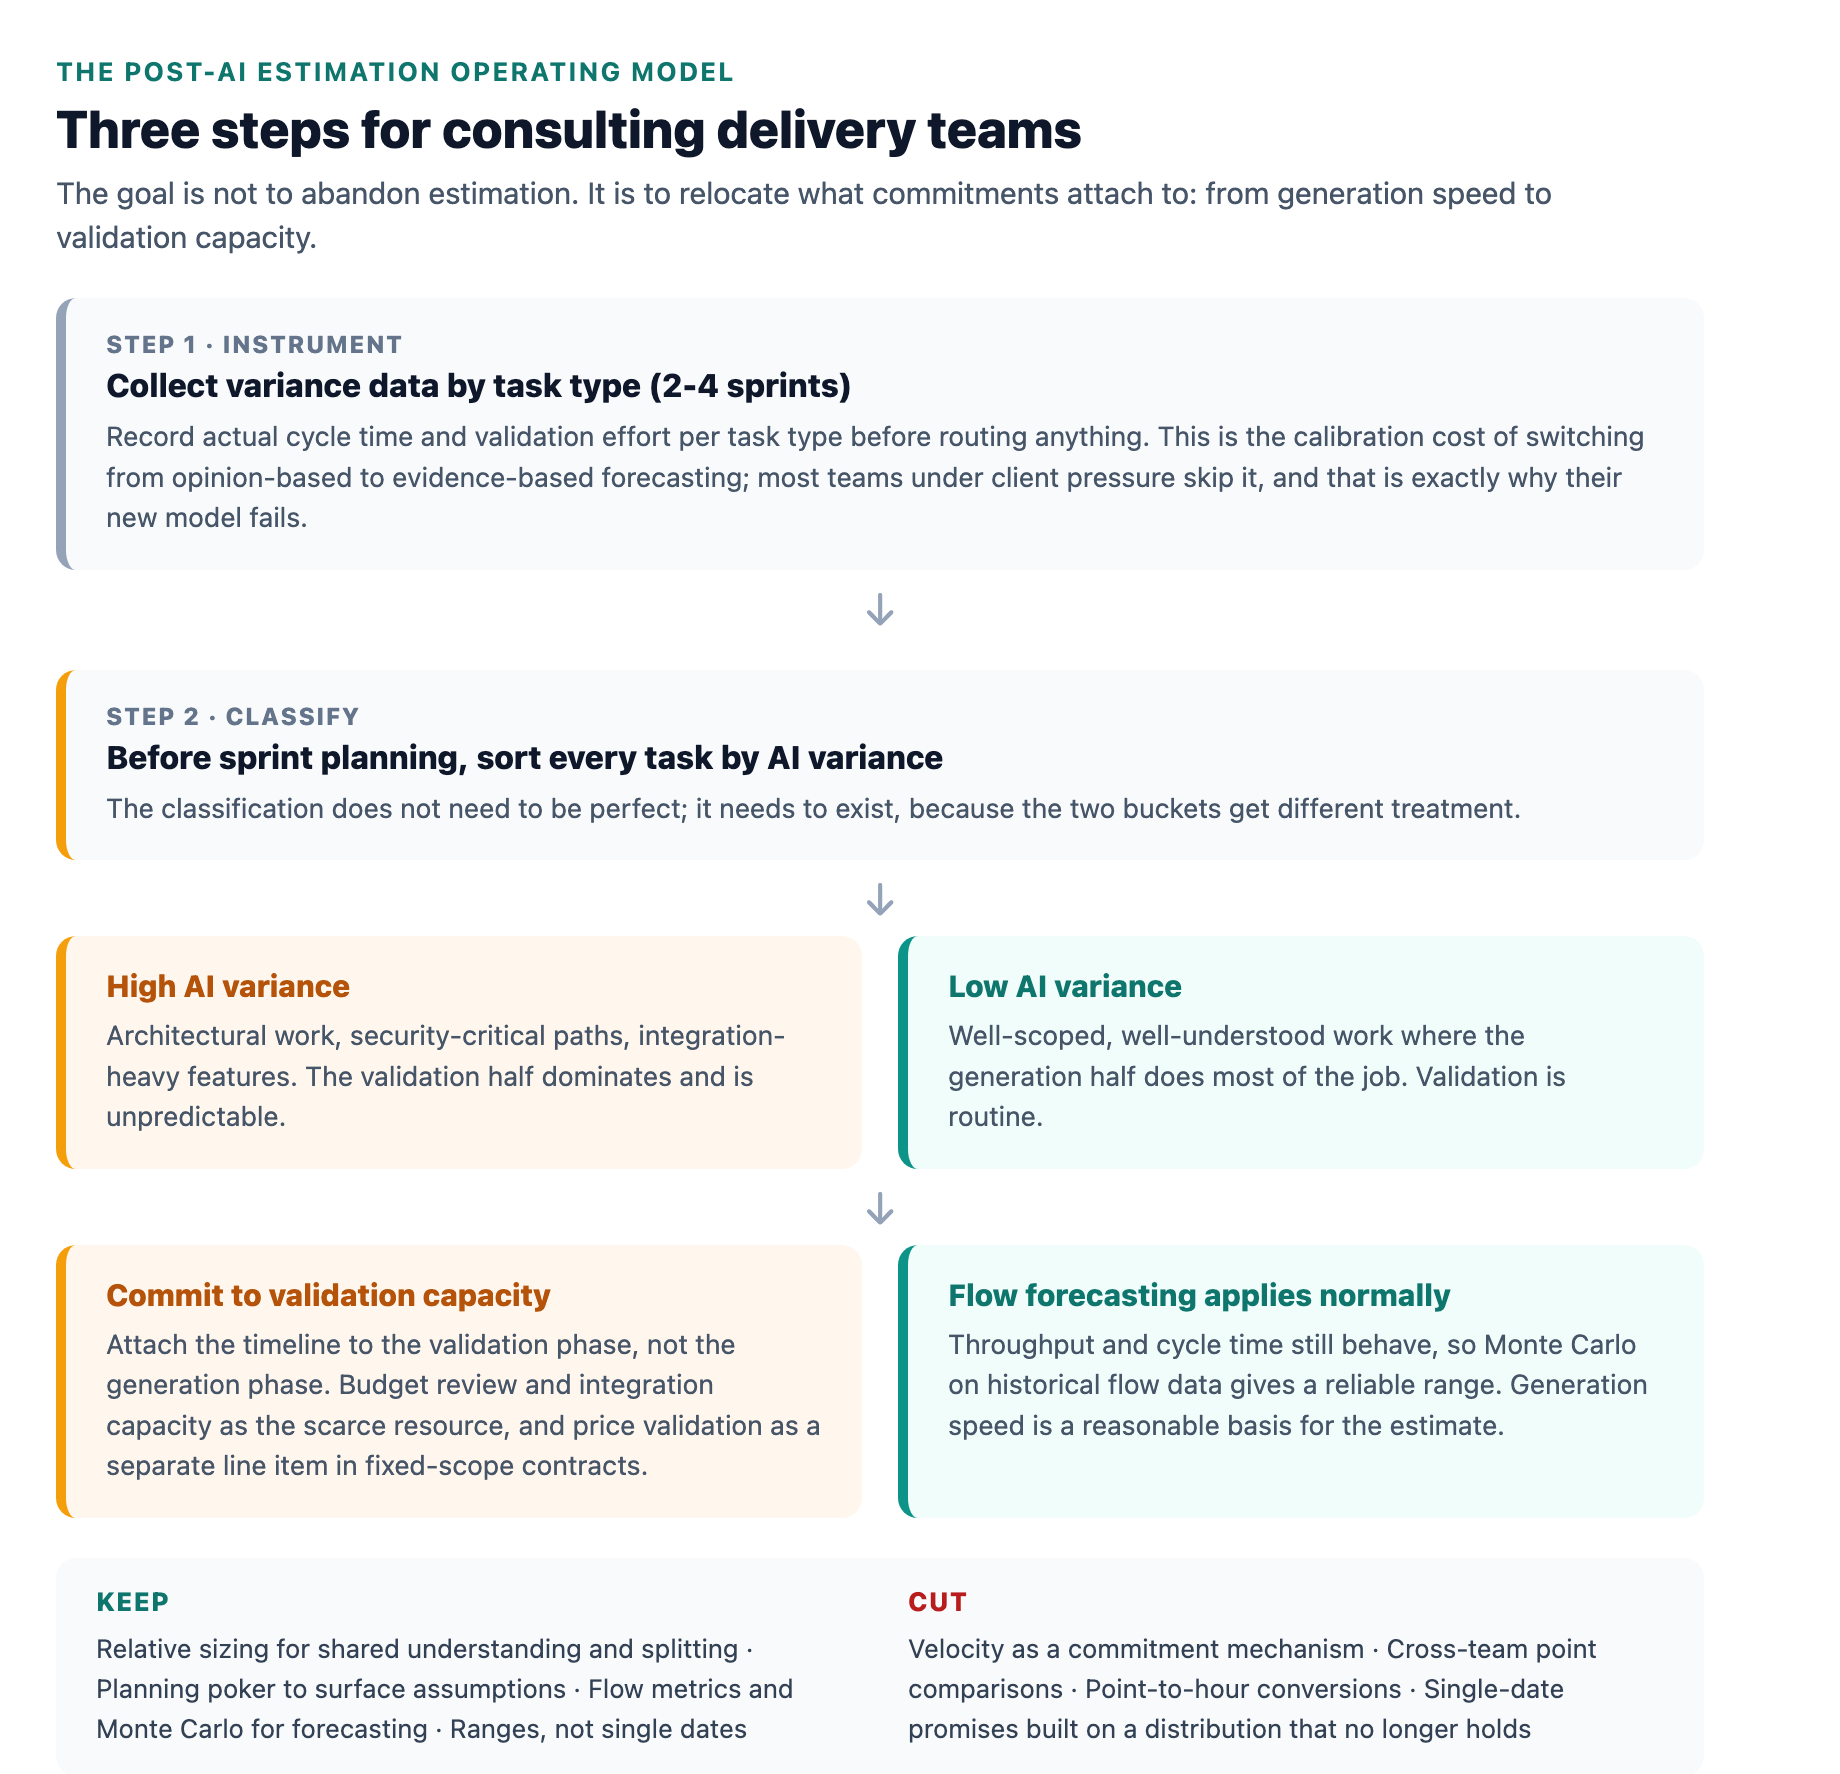
Keep the parts of story points that still work: relative sizing is still the fastest way to build shared understanding and to force the assumptions out of a requirement, and planning poker still surfaces risks a single estimator would miss. What you cut is the forecasting role. Velocity stops being a commitment mechanism and becomes a conversation artifact; cross-team point comparisons stop; point-to-hour conversions stop. Forecasts come from flow data, commitments come from validation capacity, and story points go back to doing the one job they were designed for: helping a team agree on relative size.
The one-line version
The shift is from "estimate effort, then commit to scope" to "estimate the variance profile, then design the delivery architecture around it" 1. Story points are not dead; they are demoted. In 2026 the teams that can still promise a date are the ones that stopped pretending the number was ever precise, and started forecasting the range their data actually supports.
Sources
-
StratoAtlas, "Your velocity went up. Your estimates stopped meaning anything.". stratoatlas.com ↩ ↩2 ↩3 ↩4 ↩5 ↩6 ↩7 ↩8 ↩9
-
Scrum.org, "Story Points: To Estimate or Not to Estimate". scrum.org ↩ ↩2
-
55degrees, "Why estimation struggles at scale, and what delivery leaders can use instead". 55degrees.se ↩ ↩2
-
Scrum.org, "4 Key Flow Metrics and How to Use Them in Scrum's Events". scrum.org ↩ ↩2 ↩3 ↩4