
PMI's Pulse of the Profession 2026, published in May under the title "Driving Success in Complex Projects," opens with a number that should reset how delivery teams plan: 97% of project professionals managed at least one complex project in the past year, and more than half classified those projects as significantly complex 1. Complexity is no longer an exceptional condition to plan around. It is the baseline. The report's most useful finding, though, is that high performers do not face less complexity, they respond to it differently, and the response is teachable: five concrete practices separate the teams that absorb complexity from the teams it undoes 2.
Complexity is now the default state of project work
The headline numbers are unambiguous. Eighty-one percent of project professionals say projects have become more complex in recent years, with 37% describing a significant increase 2. The consequences are measurable: 31% of complex projects fail to achieve the full scope of their originally intended benefits, more than double the 12% failure rate PMI recorded in its 2024 Maximizing Project Success research 3. Four out of five complex projects experience some form of fallout from poorly managed complexity, and the average complex project stacks 2.1 distinct negative outcomes out of the twelve the survey evaluated 2.
Scale and sector both shape the odds. In organizations of 100,000 or more employees, 91% of professionals report rising complexity, versus 78% in companies under 500 people, a thirteen-point coordination gap driven purely by organizational size 2. Across industries, over half of all projects read as complex, led by healthcare (60.8%), energy (60.5%) and financial services (60.1%), with consulting itself at 54.4% and only training and education (45.7%) dipping below half 4.
The payoff for getting this right is not marginal. Teams highly effective at managing complexity delivered an 88% success rate, versus 14% for teams that were only slightly effective or ineffective, and projects that manage complexity well are five times more likely to succeed 2. The 74-point spread between those two outcomes is the entire business case for treating complexity management as a skill, not a slogan.
Where complexity comes from: three dimensions
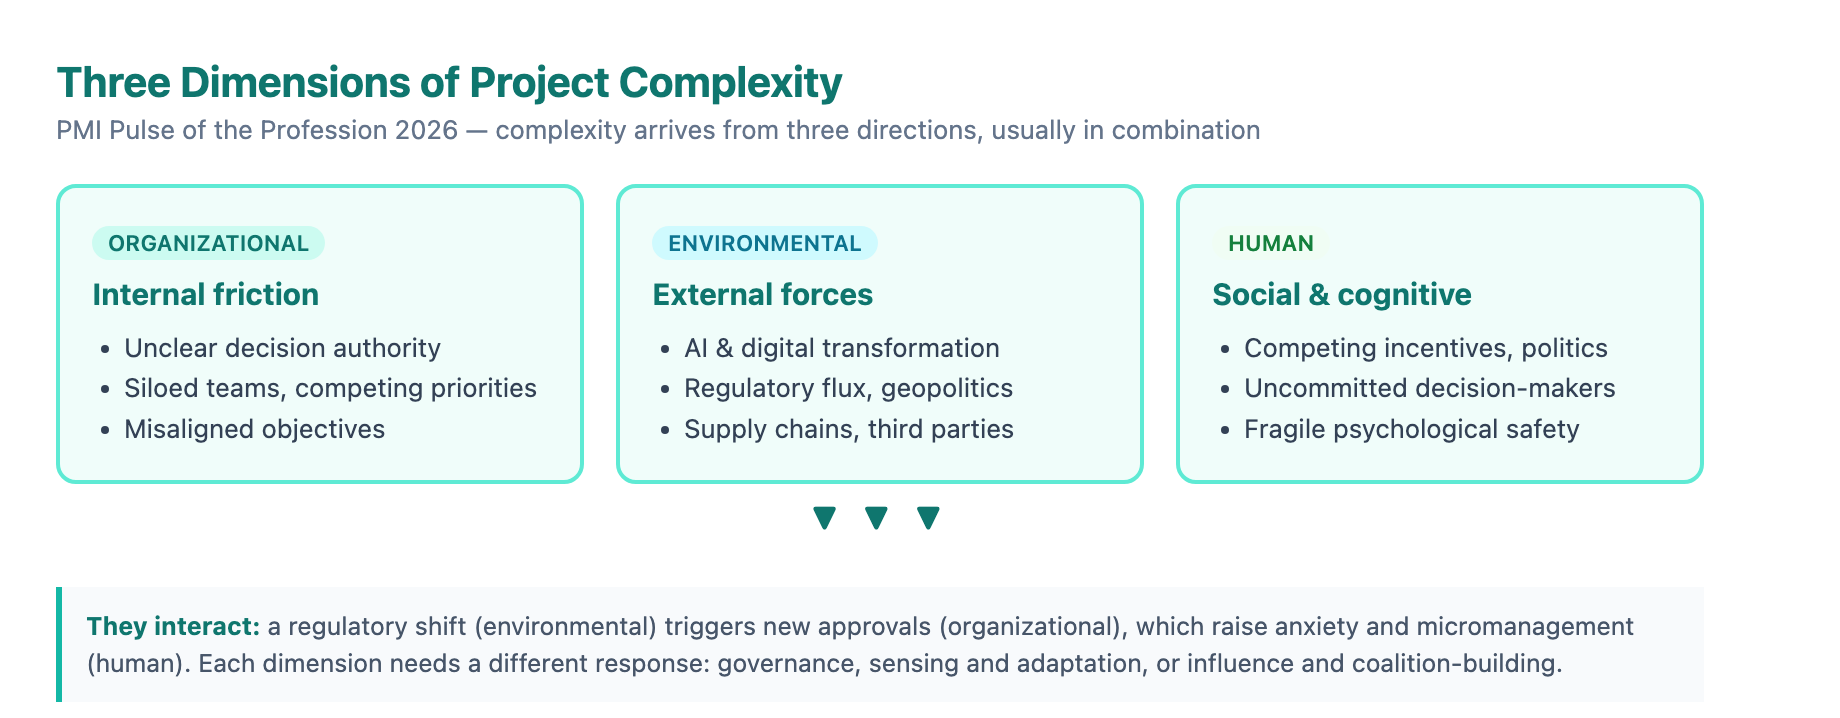
PMI's framework for diagnosing complexity is deliberately simple: complexity arrives from three directions, and most projects carry a mix. The organizational dimension is internal friction, unclear decision-making authority, siloed teams, competing priorities and misaligned objectives. The environmental dimension is everything external: AI and digital transformation, regulatory flux, geopolitical shifts, supply chains and third-party collaborators that reshape the context faster than the plan can absorb. The human dimension is the social and cognitive layer, competing incentives, politics and relationship dynamics that show up as uncommitted decision-makers, second-guessed direction and fragile psychological safety 2.
The three dimensions rarely arrive alone, and their interaction is what makes complexity feel unmanageable. A regulatory shift (environmental) triggers new internal approvals (organizational), which raise anxiety and micromanagement (human). Economic pressure (environmental) forces cost cuts on unchanged objectives (organizational), which strains team morale (human) 2. Diagnosing the dimension matters because the response differs: organizational complexity needs governance and decision rights, environmental complexity needs sensing and adaptation, human complexity needs influence and coalition-building. Applying the wrong response to the wrong dimension, say, tightening control against a political problem, actively makes things worse.
The report also documents a perception gap that explains many stalled projects: leaders and practitioners are navigating the same environment but diagnosing it differently. Faster technology and tool cycles are named as a complexity driver by 57% of project professionals but only 30% of senior leaders; digital transformation and AI adoption by 44% versus 27%; more stakeholders across functions and geographies by 45% versus 27% 4. When the diagnosis diverges, the response diverges, which is exactly the strategy-execution gap CEOs consistently name as their top challenge 2. The practical fix is a shared vocabulary: put the same complexity inventory in front of both groups and force the conversation.
What complexity actually does to projects
Complexity rarely presents as an abstract condition. It shows up as three clusters of everyday damage, and the report quantifies each. Value and alignment gaps are the most pervasive, hitting 61% of complex projects: delayed stakeholder decisions (34%), compromised or failed strategy execution (28%), budget overruns (12%), profit loss (9%) and critical safety issues (7%). Delivery disruptions follow at 55%: missed deadlines (35%), widespread operational inefficiency (23%), missed scope or quality targets (16%) and outright project failure (6%). The human impact, 31%, is the most invisible and arguably the most expensive over time: decreased team morale (19%), decreased customer satisfaction (12%) and decreased employee engagement (11%) 4.
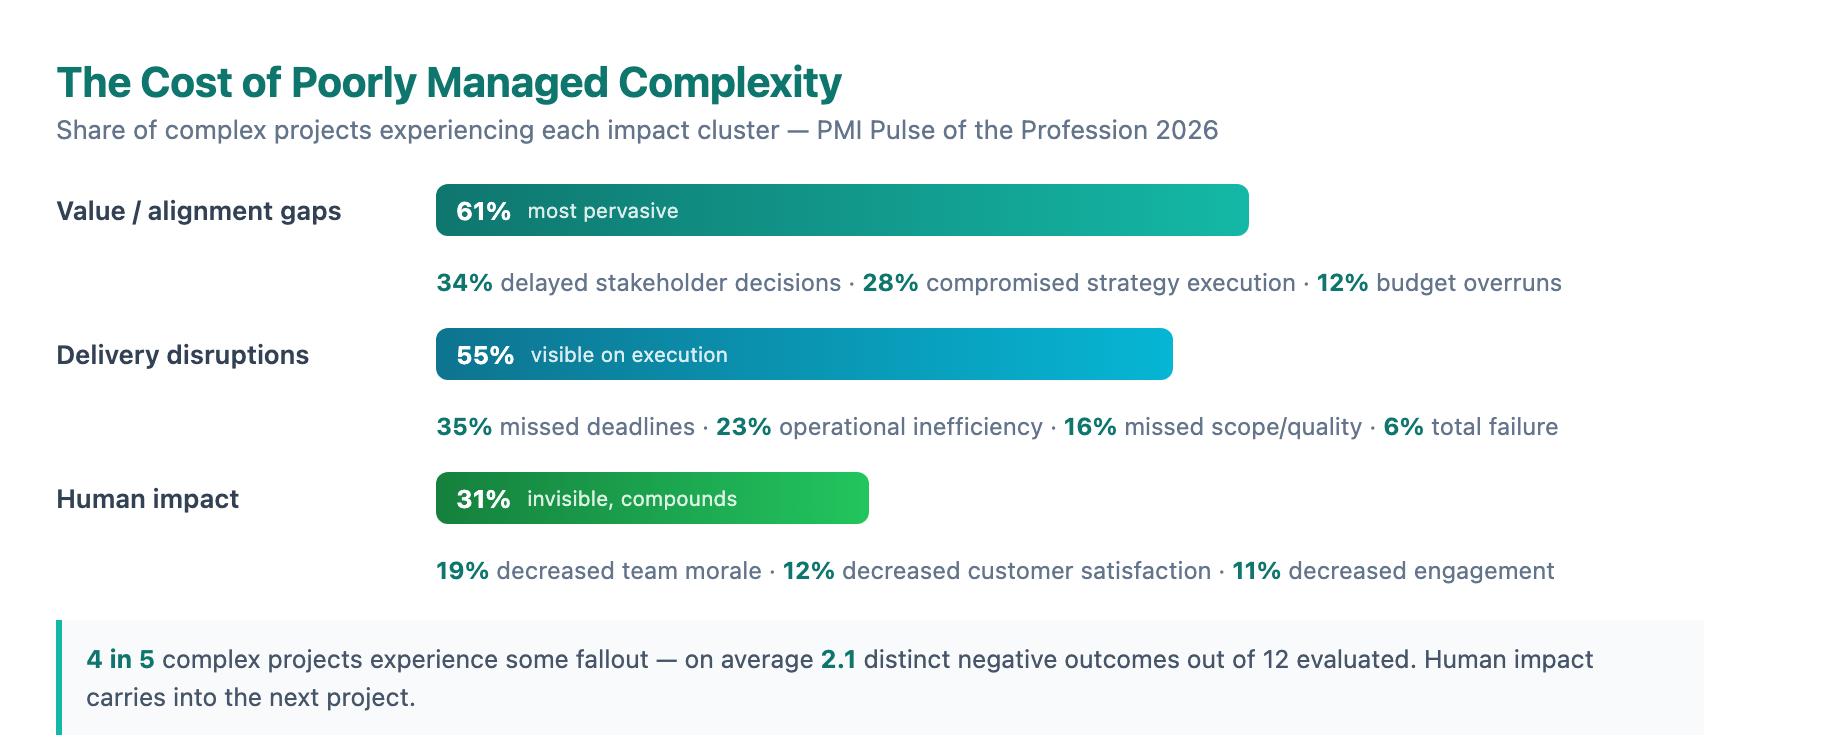
Two properties of these clusters matter for planning. First, they compound across projects: a team fatigued by one complex project carries that strain into the next, creating drag that outlasts any single initiative 2. Second, complexity is not the same thing as risk. Risk management targets specific, identifiable events; complexity is the condition that makes projects difficult to predict and stabilize in the first place. Complexity is a source of risk, and risks are its consequences, which is why a mature risk register alone never fixes a complex project 2. The distinction between complicated and genuinely complex work, and how to diagnose which one you are facing, is the subject of our complexity diagnostic.
The five practices that move the needle
The heart of the 2026 Pulse is a lever analysis: which practices actually separate high performers from low performers on complex projects? Five practices correlate with above-average performance, and the gaps are specific enough to act on.
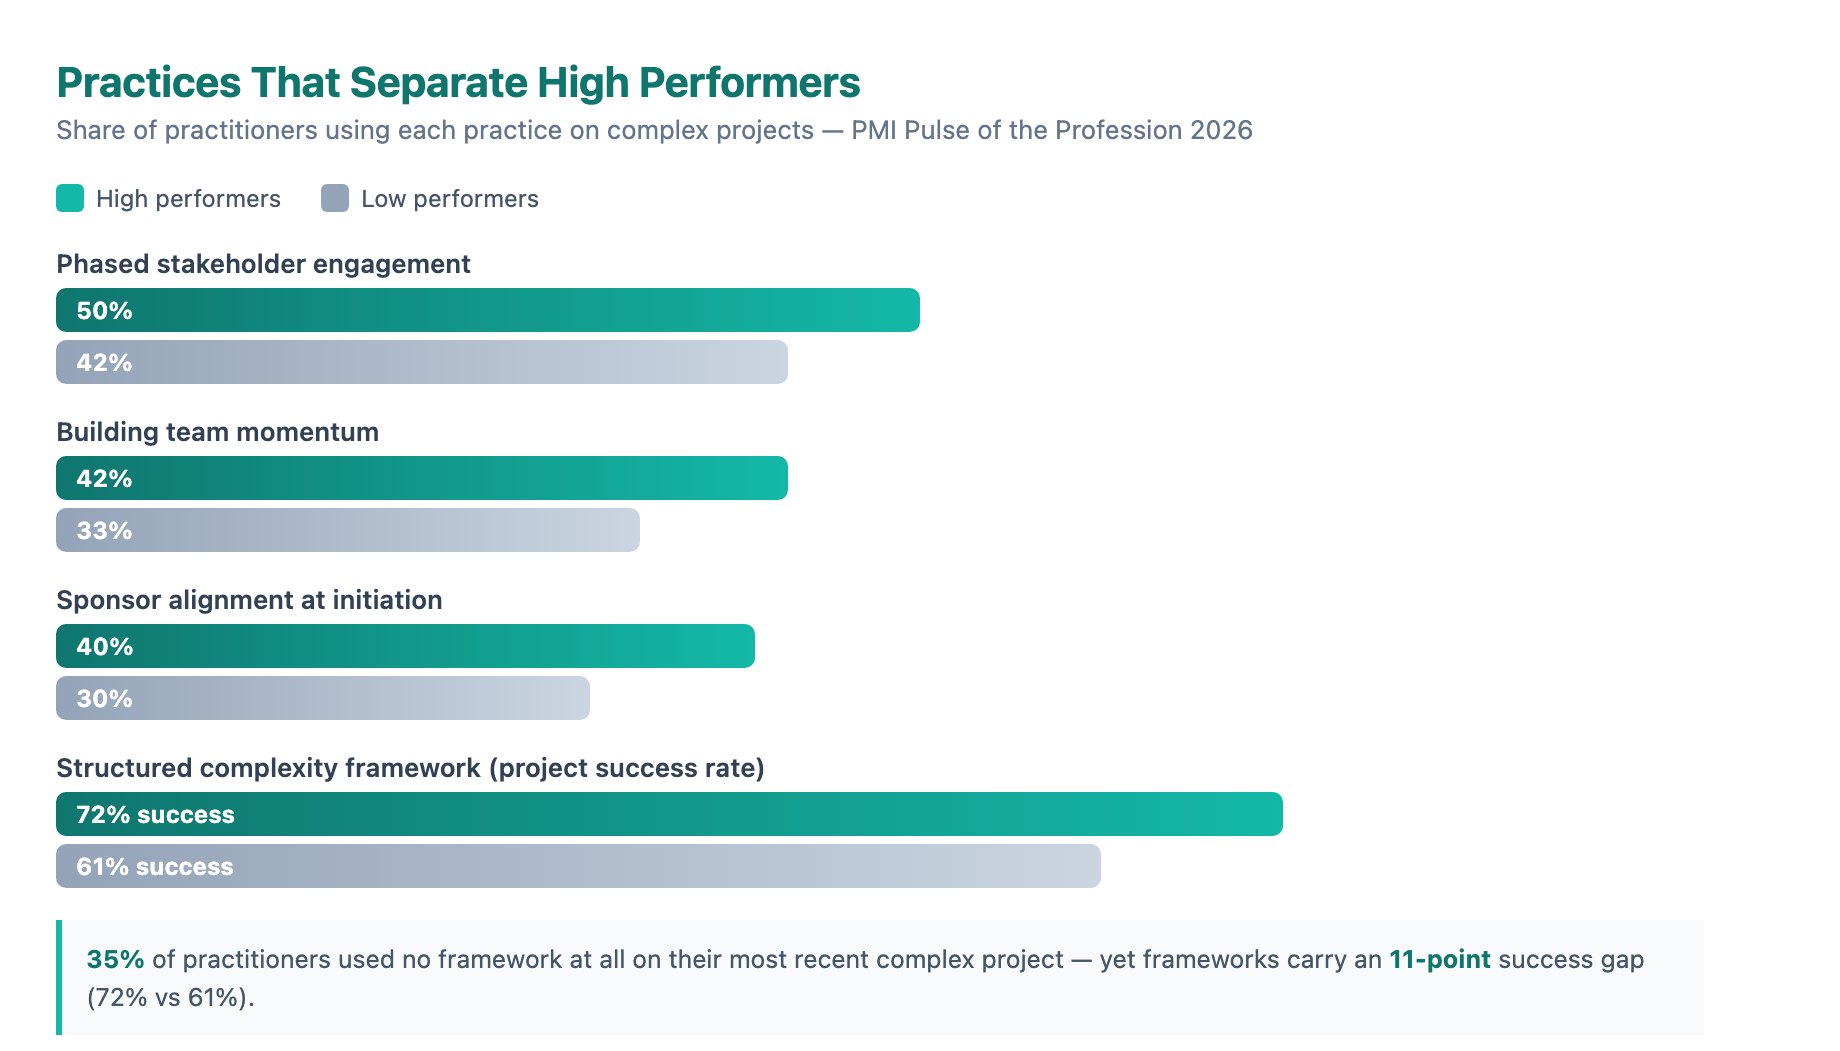
Sponsor alignment at initiation. Forty percent of high performers secure it, versus 30% of low performers, and it establishes what the project is, what success looks like and who is accountable before execution begins 2. Practitioners describe it as deliberate relational work: Vugar Rustamli, a project management consultant at PMWill in Czechia, spent weeks convincing the sponsor before engaging any stakeholder group, and credits that sequence for the project's survival 2. SLB's HQ integration PMO institutionalizes the same idea by bringing the VP directly into stage-gate preparation, so alignment is built into the rhythm of the project rather than retrofitted when problems appear.
Phased stakeholder engagement. High performers engage the right people at the right time 50% of the time, versus 42% for low performers 2. The practice is continuous triage, not a single kickoff: discovery defines who the stakeholders are, initiation invites the senior ones in, and the engagement list is re-evaluated as the project evolves. Hassene Siddat of the WHO Western Pacific Region describes how putting key players together on the project board early, with regular cross-team updates, turned stakeholder engagement from a risk activity into an alignment engine 2.
Building and maintaining team momentum. Used by 42% of high performers versus 33% of low performers, this is the practice of making progress tangible when progress is rarely linear: celebrating wins and milestones, socializing a clear point of view on value creation, and keeping participants focused on the value the project creates rather than the tasks it contains 2. The report's appendix confirms the mechanism: celebrating wins and milestones shows a nine-point gap between above- and below-average performers, second only to sponsor alignment 4.
Scenario planning. About one in five practitioners use it, yet it shows its strongest effect in the early stages of a project, where it strengthens risk management by surfacing emerging threats, mapping interdependencies and preparing responses before disruptions compound 2. It is the most underused lever in the set, which makes it the cheapest source of differentiation.
Structured frameworks. Applying any framework, proprietary or academic, for identifying and thinking about complexity lifts success from 61% to 72%, yet 35% of professionals used no framework at all on their most recent complex project 2. The PMO effect runs through the same mechanism: organizations with a PMO manage complexity successfully 63% of the time versus 57% without one, use structured frameworks 71% versus 55%, and secure sponsor alignment at initiation 38% versus 30% 4.
Systems thinking and the M.O.R.E. mindset
Underneath the five practices sits a capability most teams never name. Only 23% of project professionals identify systems thinking as critical for navigating complexity, yet it is precisely the lens the practices depend on: treating the project as a web of interdependencies, assumptions and feedback loops instead of a list of tasks 2. The report's operational advice is refreshingly concrete: ask what is really going on, who and what are influencing the project, and how the situation is changing, then keep asking as the project moves.
PMI's companion research, Step Up (December 2025), frames the same behaviors as M.O.R.E.: manage perceptions, own success, relentlessly reassess and expand perspective. Project professionals who consistently practice all four lift their success scores from 27 to 94 on PMI's Net Project Success Score, yet only 7% currently do 5. The same study found that 69% of stakeholders and executives expect project professionals to take primary responsibility for exactly these behaviors, and that 45% of ultimately successful projects were once at risk, with adaptability and communication the key to recovery 5. In other words, the expectation is already on the table, and the practices that meet it are known. The gap between the 7% who use them and the 97% who work complex projects is the opportunity.
Putting this into practice on your next engagement
Translated into a delivery checklist, the 2026 Pulse gives consulting teams a concrete sequence. Before kickoff, run the sponsor alignment conversation: agree on what success means beyond time, budget and scope, who owns it, and which metrics will be used to evaluate progress toward value, and do this before any broad stakeholder engagement. At initiation, name the complexity dimensions in the room, organizational, environmental and human, using the same inventory for both leadership and the delivery team so the perception gap surfaces early. Design stakeholder engagement as phases, not an event, and re-triage the list at each milestone. Build momentum deliberately: visible progress, celebrated milestones, and regular communication about the value being created, not just the work remaining. Run scenario planning in the first two weeks rather than after the first crisis. And adopt a framework on purpose, any structured lens for complexity, because the 11-point success gap between framed and unframed projects dwarfs the cost of choosing one.
None of this is exotic, which is the point. The report's throughline is that the traditional plan-and-control system is no longer fit for the speed and complexity of the operating environment, in the words of Michael Lurie, chief catalyst officer at Bayer 2. High performers are not smarter planners, they are better sensors: they focus on outcomes over activity, alignment over compliance and learning over certainty 1. For teams delivering in 2026, that is not a softer way to run projects. It is the only way the numbers support.
Sources
-
Pulse of the Profession 2026 report landing page. pmi.org ↩ ↩2
-
Pulse of the Profession 2026: Driving Success in Complex Projects. pmi.org ↩ ↩2 ↩3 ↩4 ↩5 ↩6 ↩7 ↩8 ↩9 ↩10 ↩11 ↩12 ↩13 ↩14 ↩15 ↩16 ↩17 ↩18 ↩19
-
Pulse of the Profession 2026 Summary and Insights. pmwares.com ↩ ↩2 ↩3 ↩4 ↩5
-
Step Up: Redefining the Path to Project Success with M.O.R.E. (2025). pmi.org ↩ ↩2